


To make a line graph in Google Sheets, follow these steps:
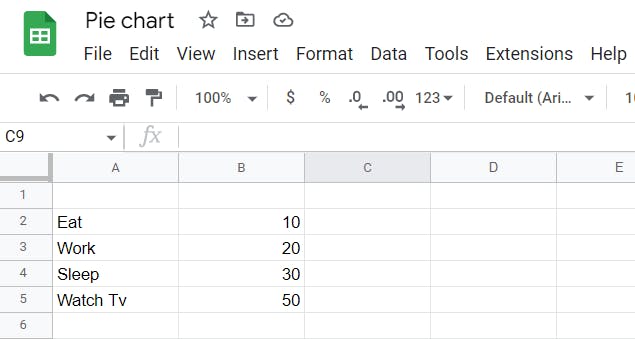
Step 1: Enter the data
Enter your data in your sheets.
E.g.
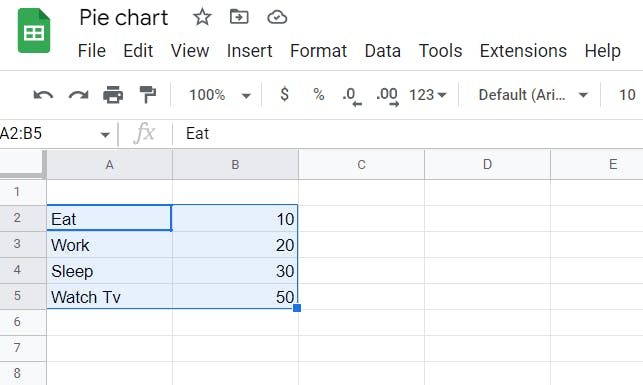
Step 2: Select the data
The second step after step 1 is to select the data.
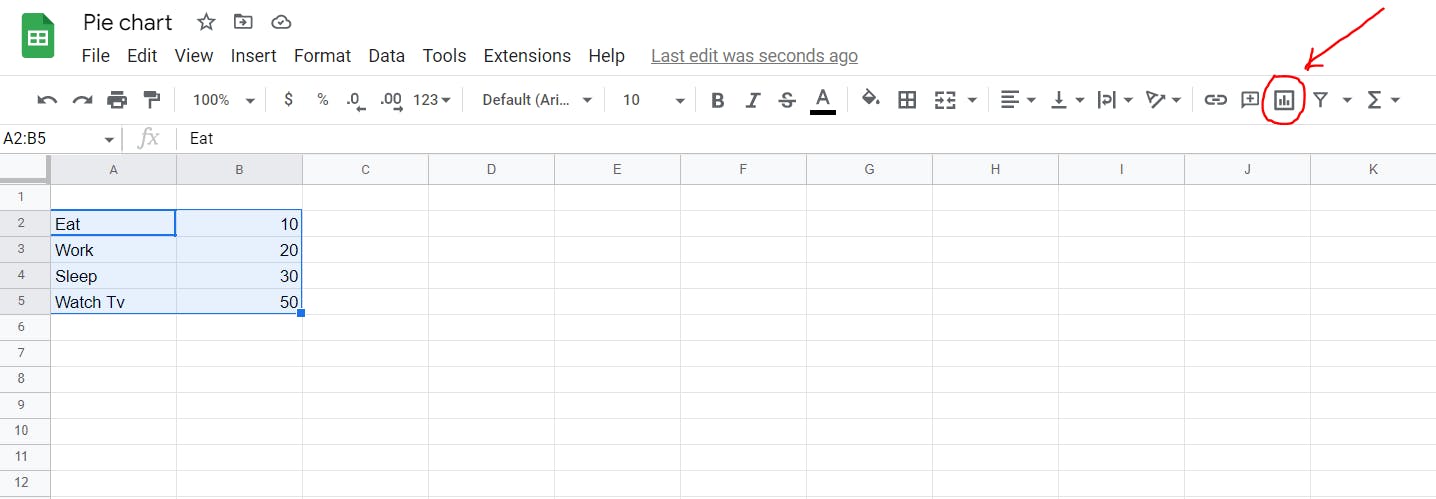
Step 3: Click on Insert Chart
Click on "Insert Chart" at the top toolbar.
Step 4: Select the Pie chart.
Select the Pie chart to create. or Sometimes it automatically creates the pie chart after clicking on the Insert chart button at the top toolbar.
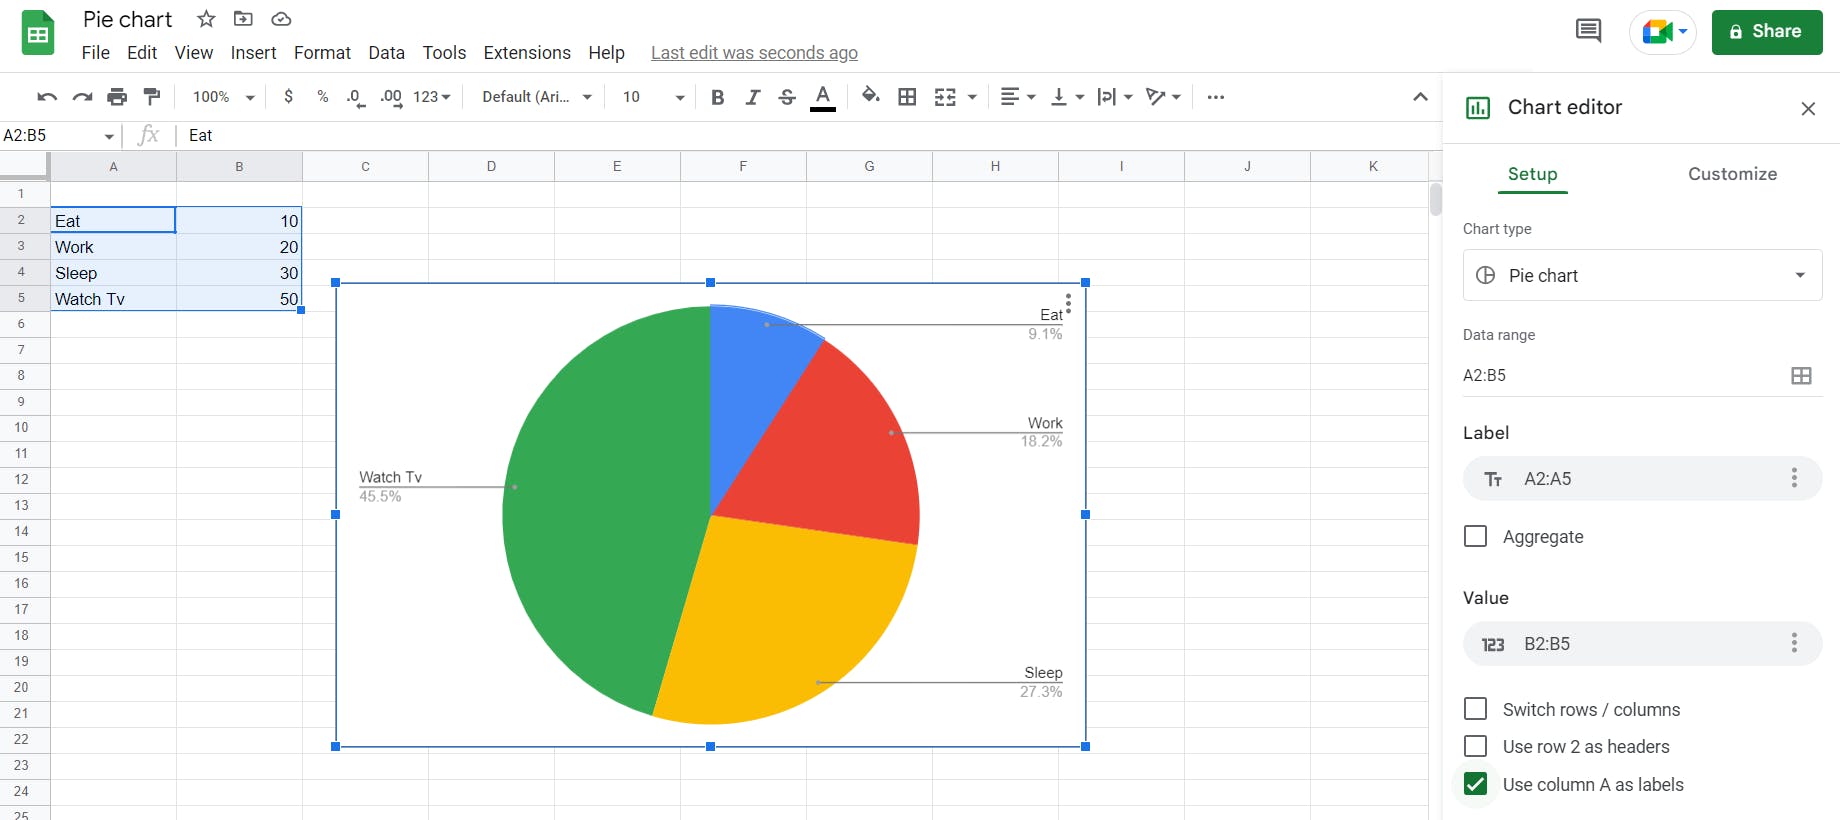
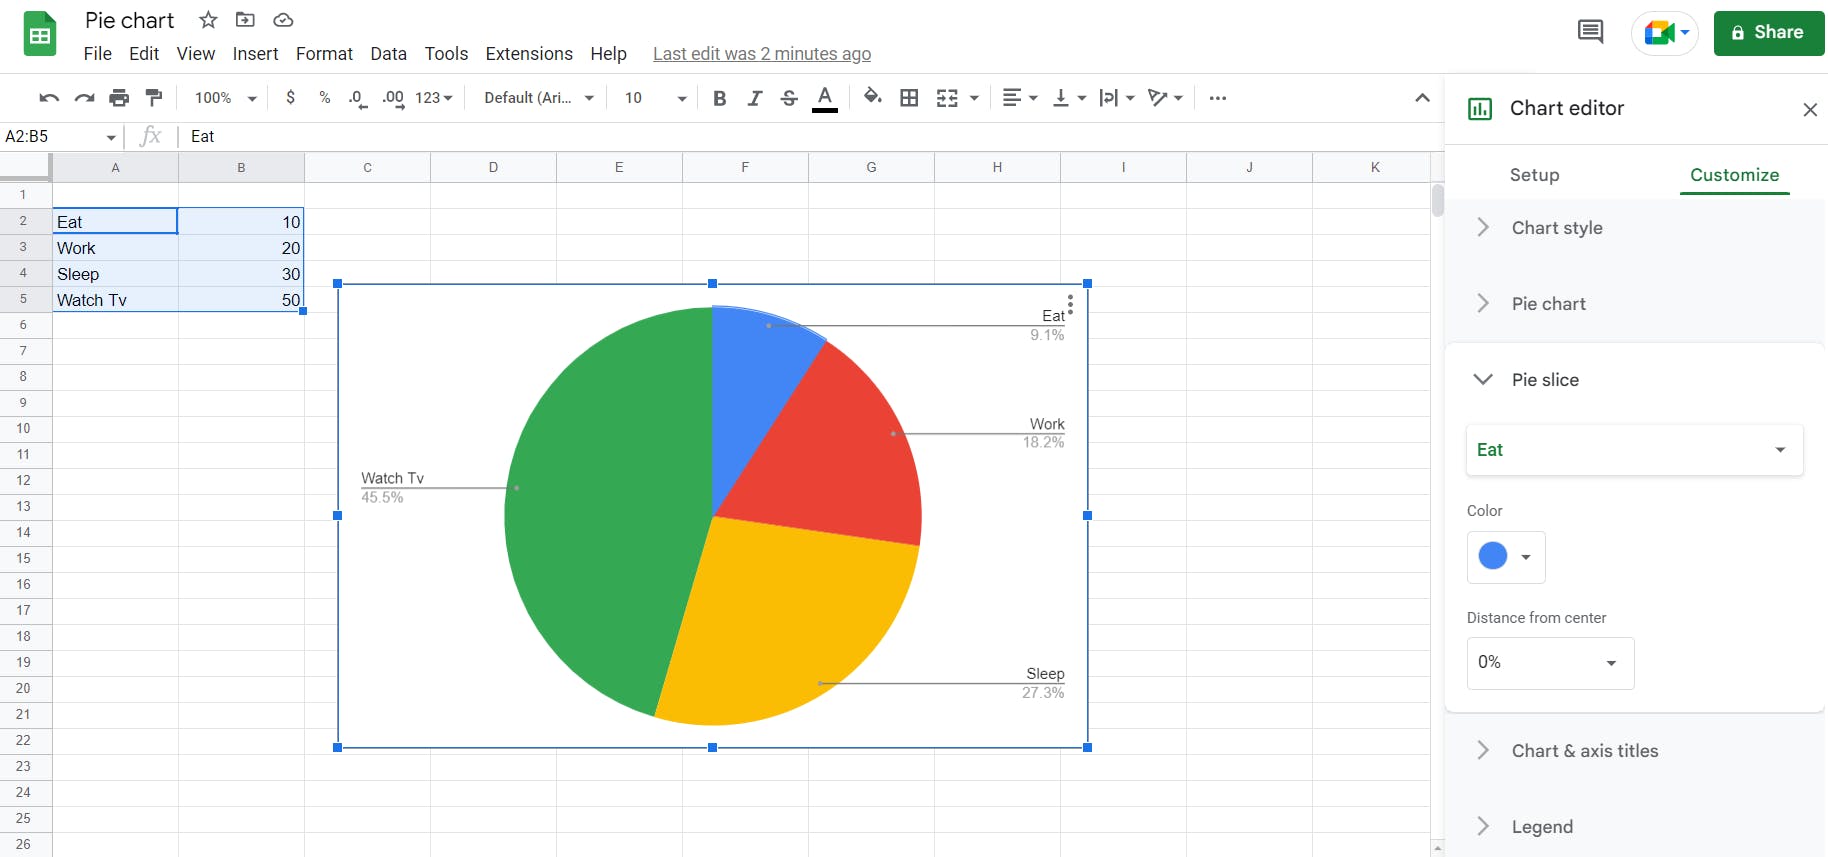
Step 5: Customize
In the final step, customize your charts such as Color, Legend, Axis, and Text.
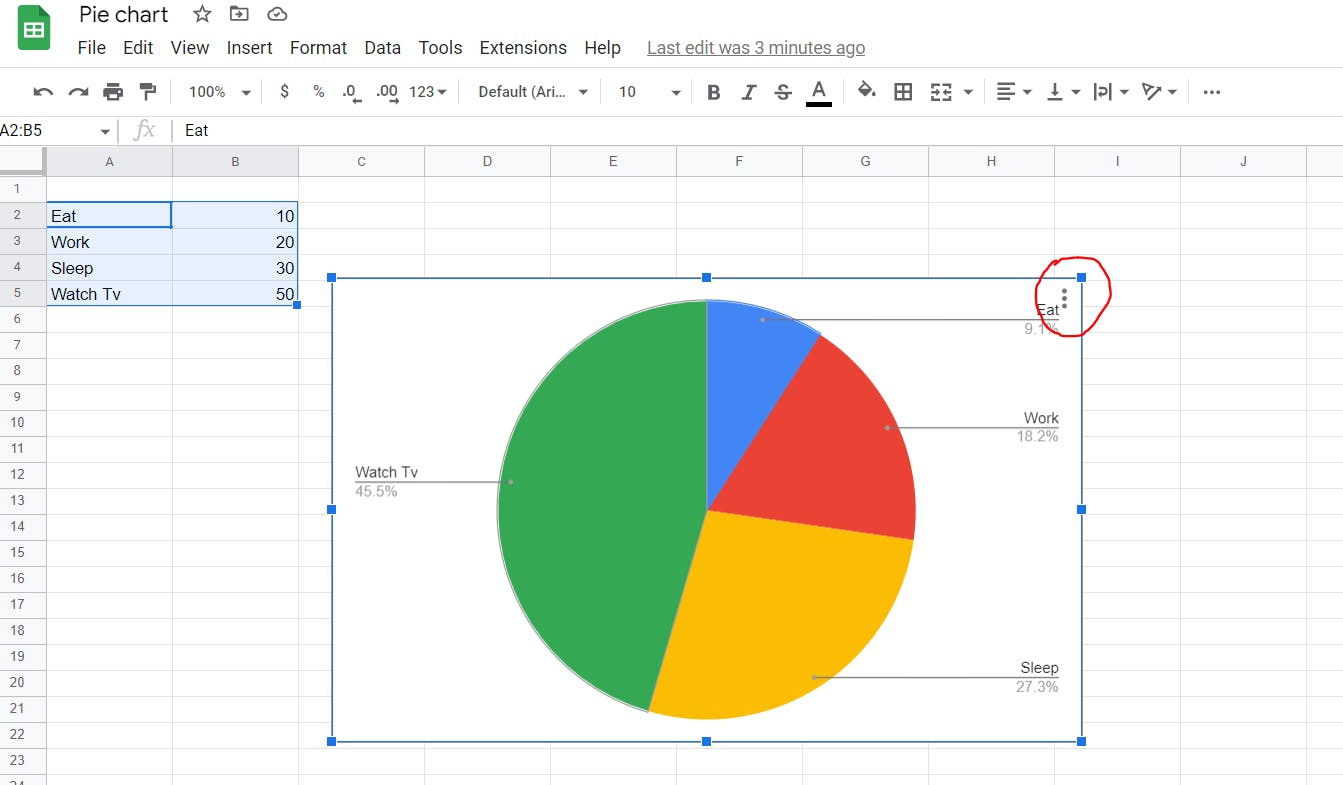
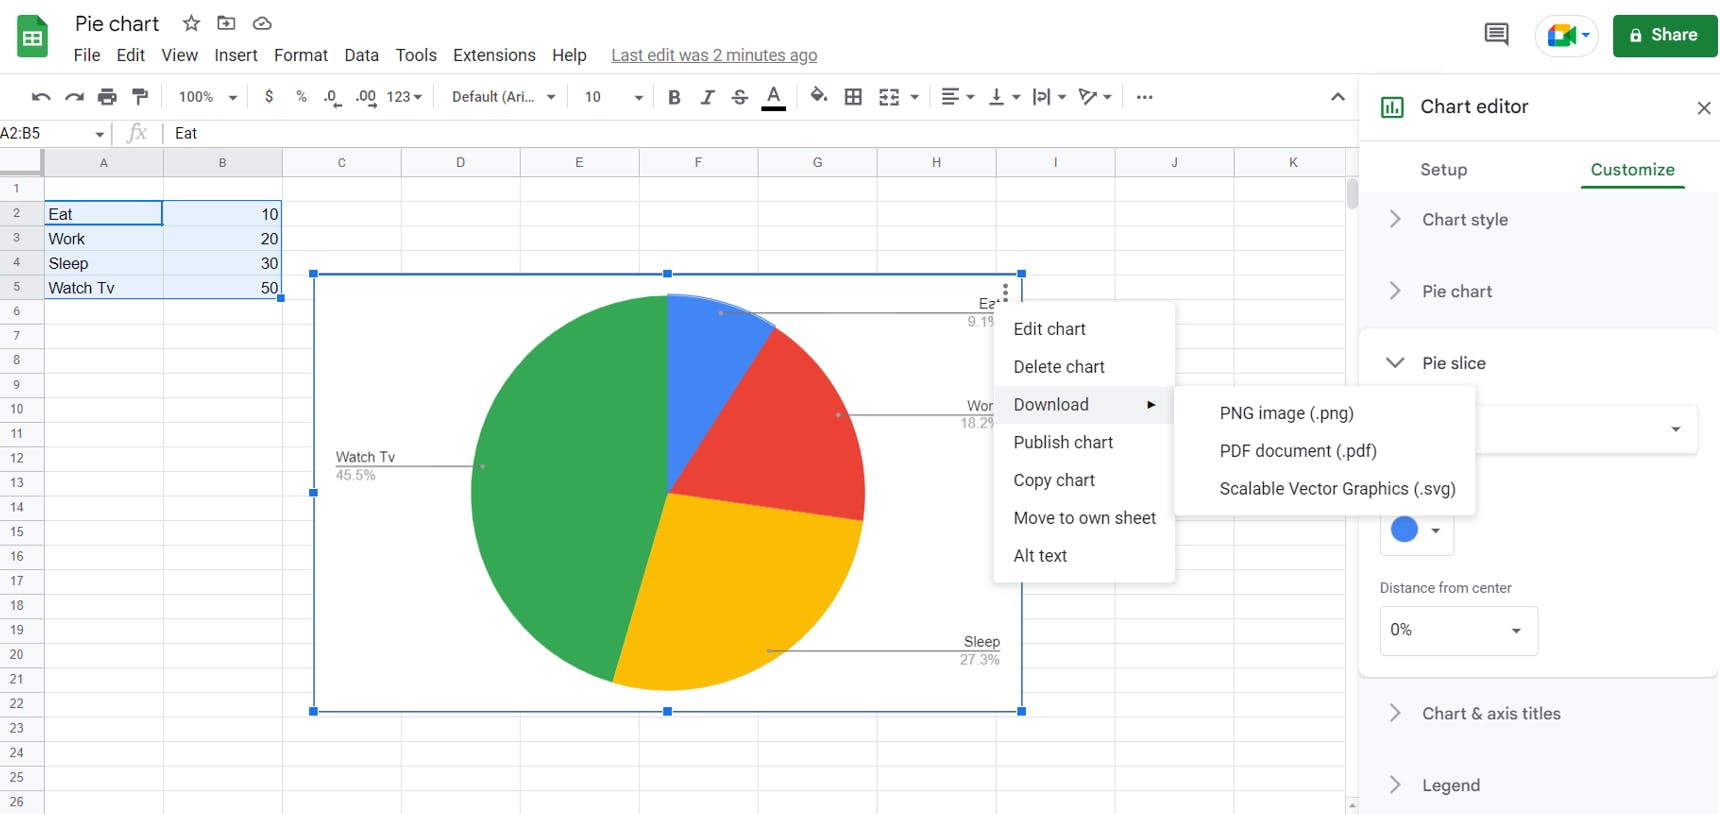
Step 6: Download
First, select your graph and click on the three dots.
Finally download your graph in png, SVG, or pdf format.
OR
You can try Pie chart maker to create charts easily.